The IDLE (Integrated Development and Learning Environment) debugger is basically PDB with buttons and controls on a window, for those who prefer a more visual tool.
The overall debugging process is:
- Set breakpoints
- Go through your code line-by-line checking variables and values
- Fix any errors that might appear
- Re-run the code and check if everything is ok, if not, go back to step 1.
Let’s see how to perform these steps on IDLE.
Code
We are going to use a piece of code that will take the items on a dictionary and print only the ones with even keys.
Save the code below in a file called print_even_values.py.
def print_items_even_values(dictionary):
    for item in dictionary:
        if(dictionary[item] % 2 == 0):
            print(f'The key {item} points to {dictionary[item]}')

if __name__ == '__main__':
    shopping_dict = {'soap': 1, 'meat': 2, 'rice': 3, 'apples': 4}
    print_items_even_values(shopping_dict)
IDLE Debugger
Python’s IDLE comes installed with Python.
You can find it among the installed programs in your computer, or by using the search tool that your Operating System provides.
Open the file print_even_values.py.

Then in the ‘Debug’ menu, click on ‘Debugger’.

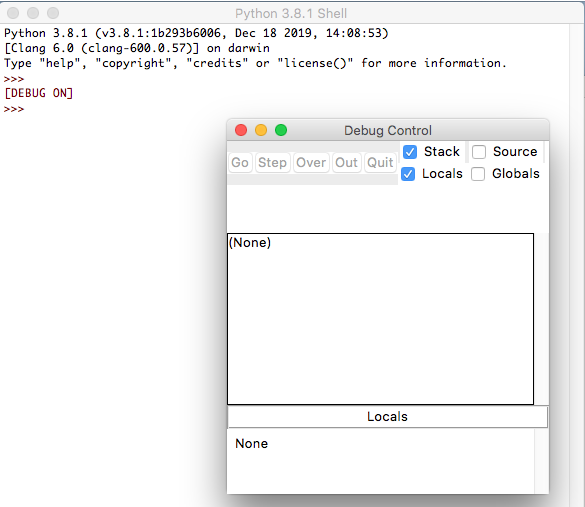
Now you have the debug control and you can see `[DEBUG ON] on Python Shell.
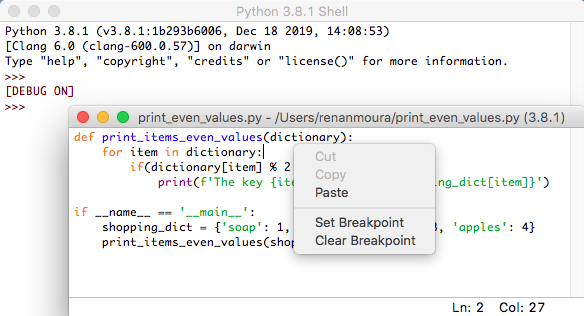
Right-Click on the line you want to set your breakpoint and click on ‘Set Breakpoint’.
The line with the breakpoint will turn yellow.
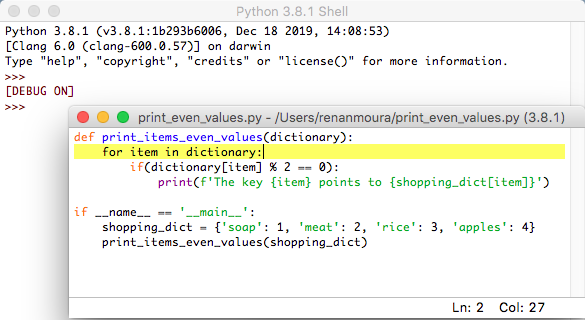
You can also remove the breakpoint from a line with a right-click ‘Clear Breakpoint’.
We are going to leave a breakpoint on the if statement.

Click on the ‘Run’ menu and then on ‘Run Module’.

The blue line indicates the current position of the program, in this case, line 1.
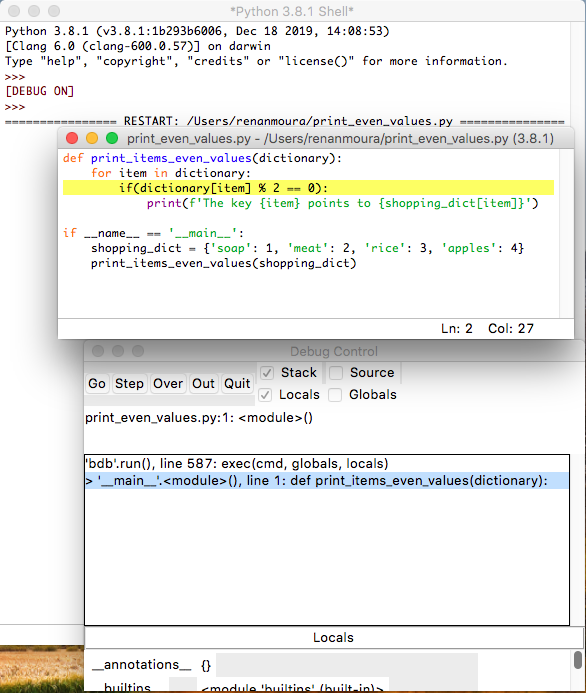
If you click on ‘Step’ on the ‘Debug Control’ window, the program will run line-by-line.
If you click on ‘Go’, the code will execute until the first breakpoint on line 3.
You can see the code is at two points, line 8 where print_items_even_keys(dictionary) is called on the main, and at line 3 where the function is executing the if statement and where our breakpoint is set.
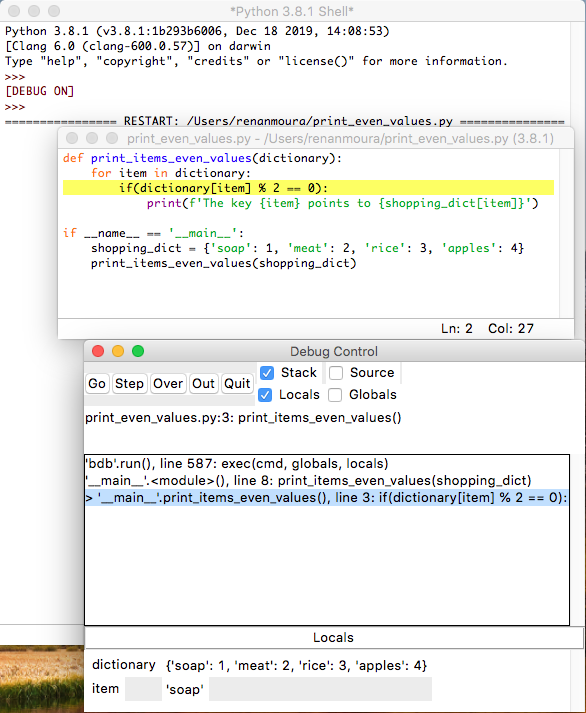
Then we click on ‘Step’, similarly to what we did with s on the Pdb, to go through each line of code.

The result is displayed on Python Shell on each step.

You can call ‘Quit’ to end the execution at any time.
‘Out’ is for when you are inside a function and want to step out of it, so the function will execute normally and the debugger will be placed on the next command after the function ends.
‘Over’ is for when there is a function to be called and you don’t want to go inside it to debug the function, the debugger will execute the function go to the next command after the function ends.